安装
/usr/local/php81/bin/phpize
./configure --enable-xdebug --with-php-config=/usr/local/php81/bin/php-config
make
make install
选择自己的版本,环境进行安装!
配置 xdebug
zend_extension=/usr/local/php8/lib/php/extensions/no-debug-non-zts-20200930/xdebug.so
xdebug.remote_enable=1xdebug.remote_autostart=1xdebug.remote_host=192.158.0.1xdebug.remote_port=9001xdebug.remote_handler="dbgp"xdebug.remote_mode="req"xdebug.idekey="PHPSTORM"xdebug.remote_connect_back=1
Xdebug 3 版本的写法
xdebug.mode=debugxdebug.start_with_request=yesxdebug.client_host=192.158.0.1xdebug.client_port=9001xdebug.client_handler=dbgpxdebug.discover_client_host=falsexdebug.idekey=PHPSTORMxdebug.remote_connect_back=1
打开phpinfo ,可以看看是否写对了。
关于host
比如phpstrom,打开debug监听之后,phpstorm会监听端口,然后远程Php的网页访问的时候,会寻找这个配置的端口和host,提供断点信息。所以这个端口、Host,是debug客户端程序(phpstorm)确定的。
配置phpstorm
1.调试端(phpstorm)
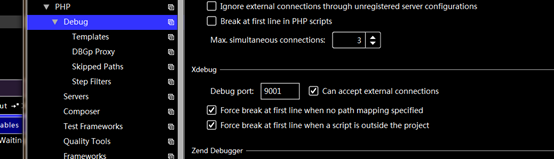
文件->设置->语言与框架中->PHP->debug
配置debug端口。
2.配置DBGP代理,host可以不填,默认当前主机(xdebug客户端phpstrom就是当前主机)
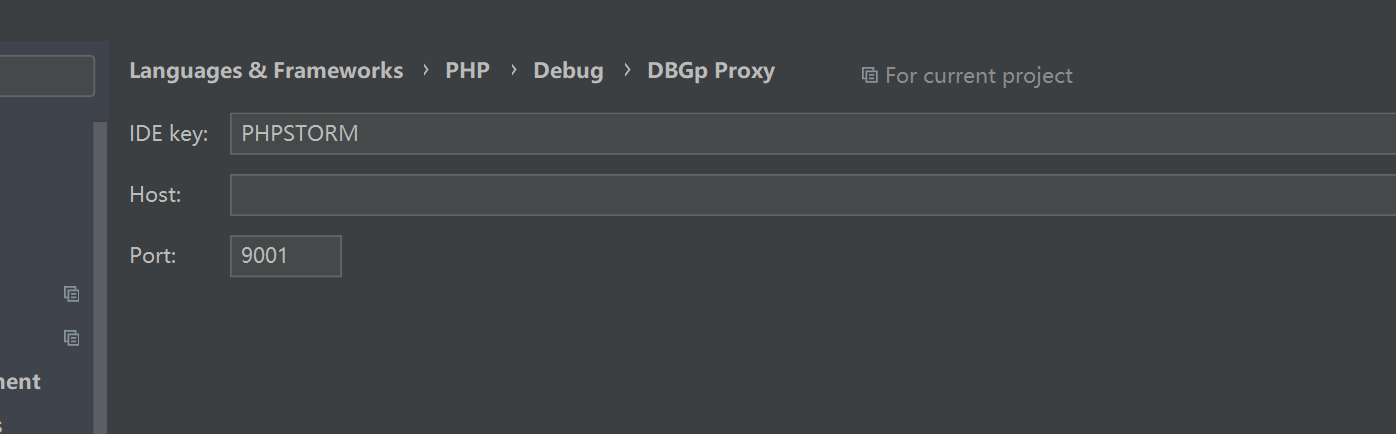
在cmd执行netstat -aon|findstr “9001”,可以监测是否监听成。
3.测试配置是否生效
配置远程校验脚本的路径,需要在域名的根目录(本地和远程都一样)
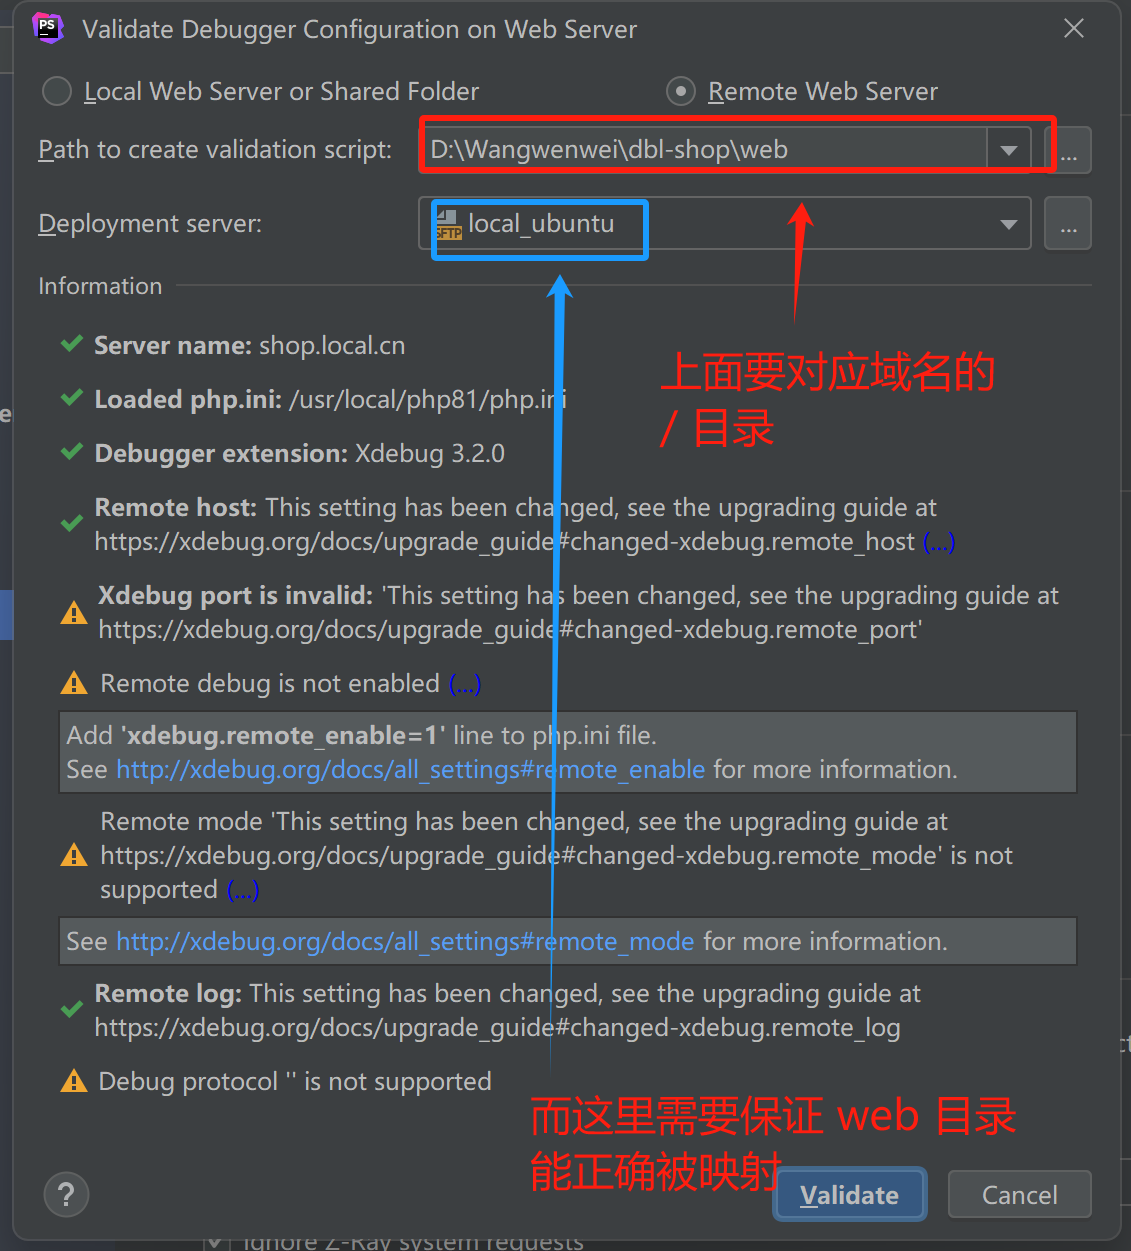
然后点击校验,看看成功与否。
如果失败,则查看phpstorm日志:
导航到菜单:Help > Show Log in Explorer/Finder,将显示日志所在目录。
默认它的日志级别很低,看不到debug,我们需要拉高日志级别:
导航到:Help > Diagnostic Tools > Debug Log Settings
输入:#com.jetbrains.php.debug
开启debug级别即可。
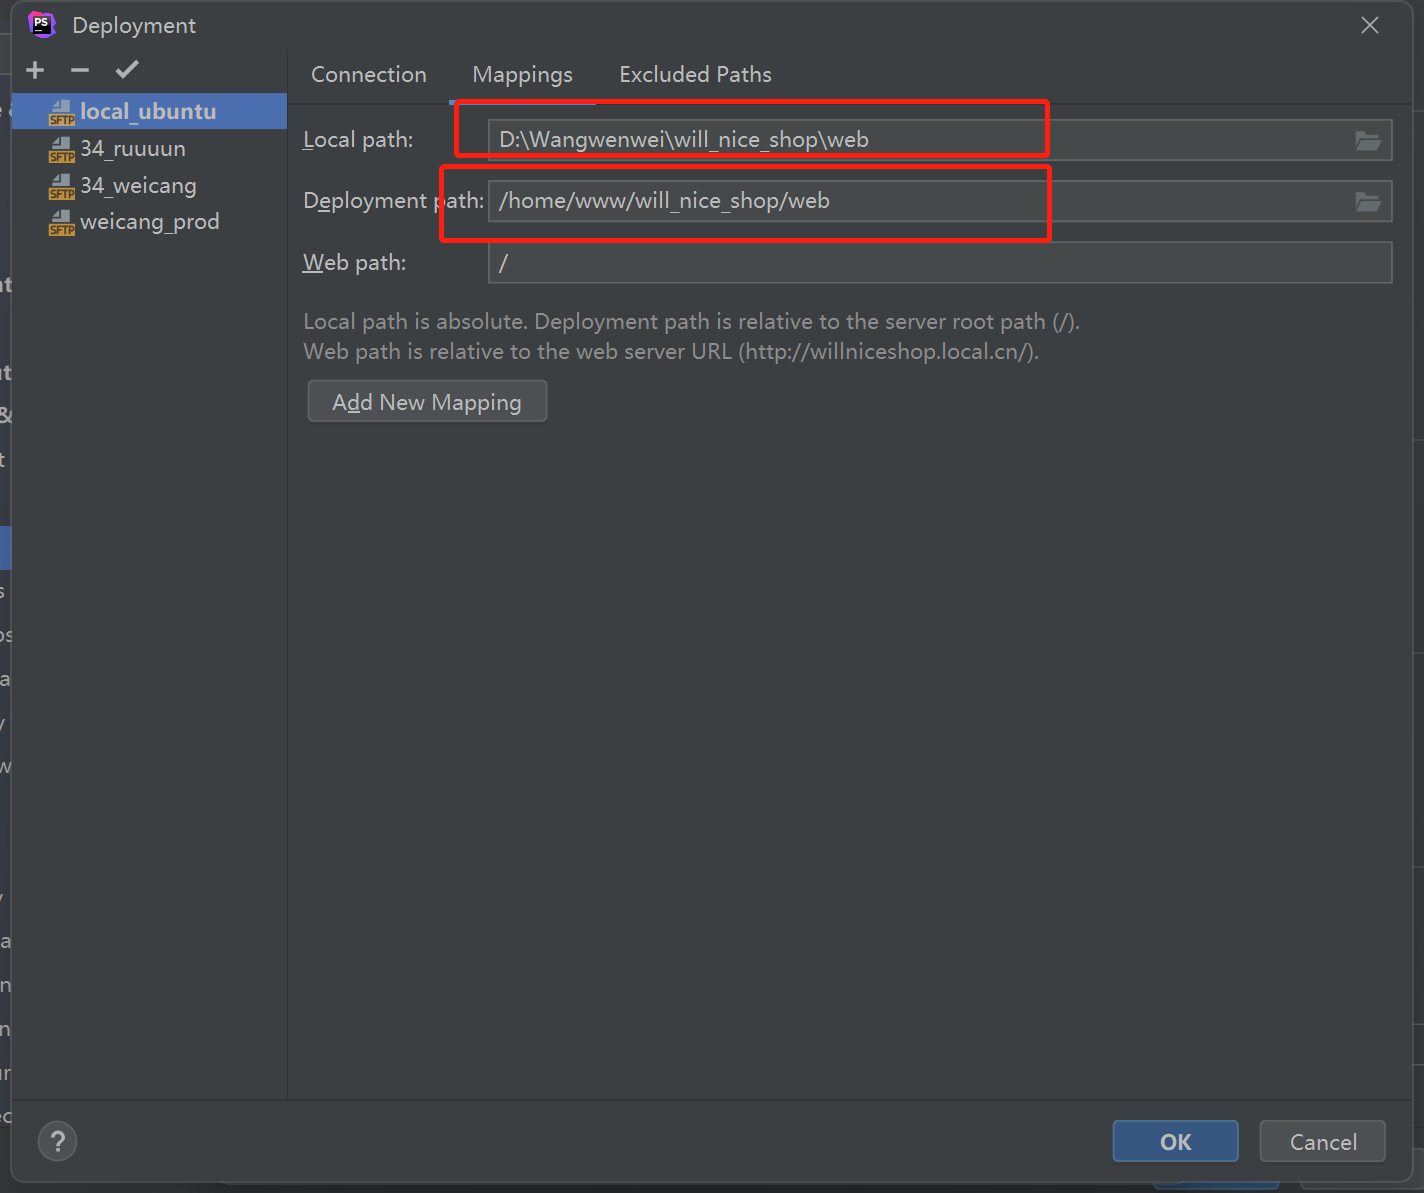
4.添加一个调试服务servers,刚刚的配置完善之后,可以添加好多个调试服务的,我们这里添加一个
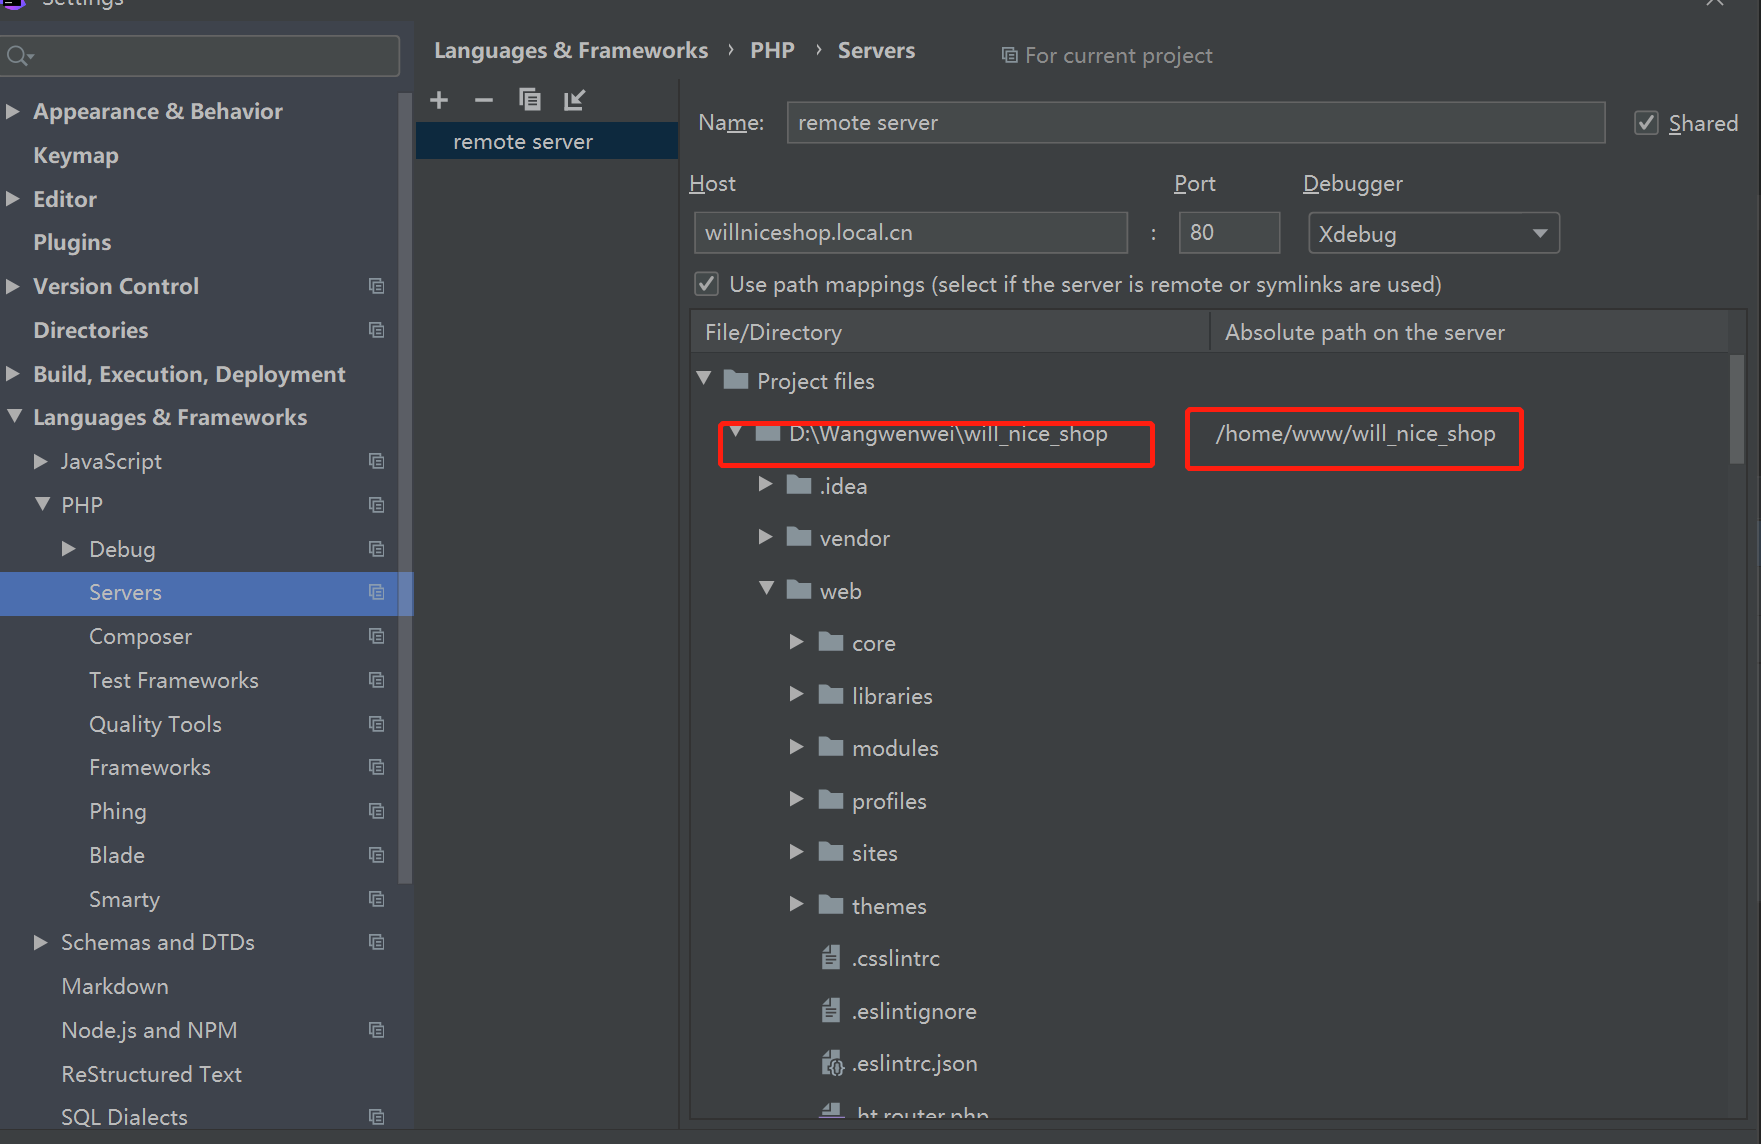
路径要对上。
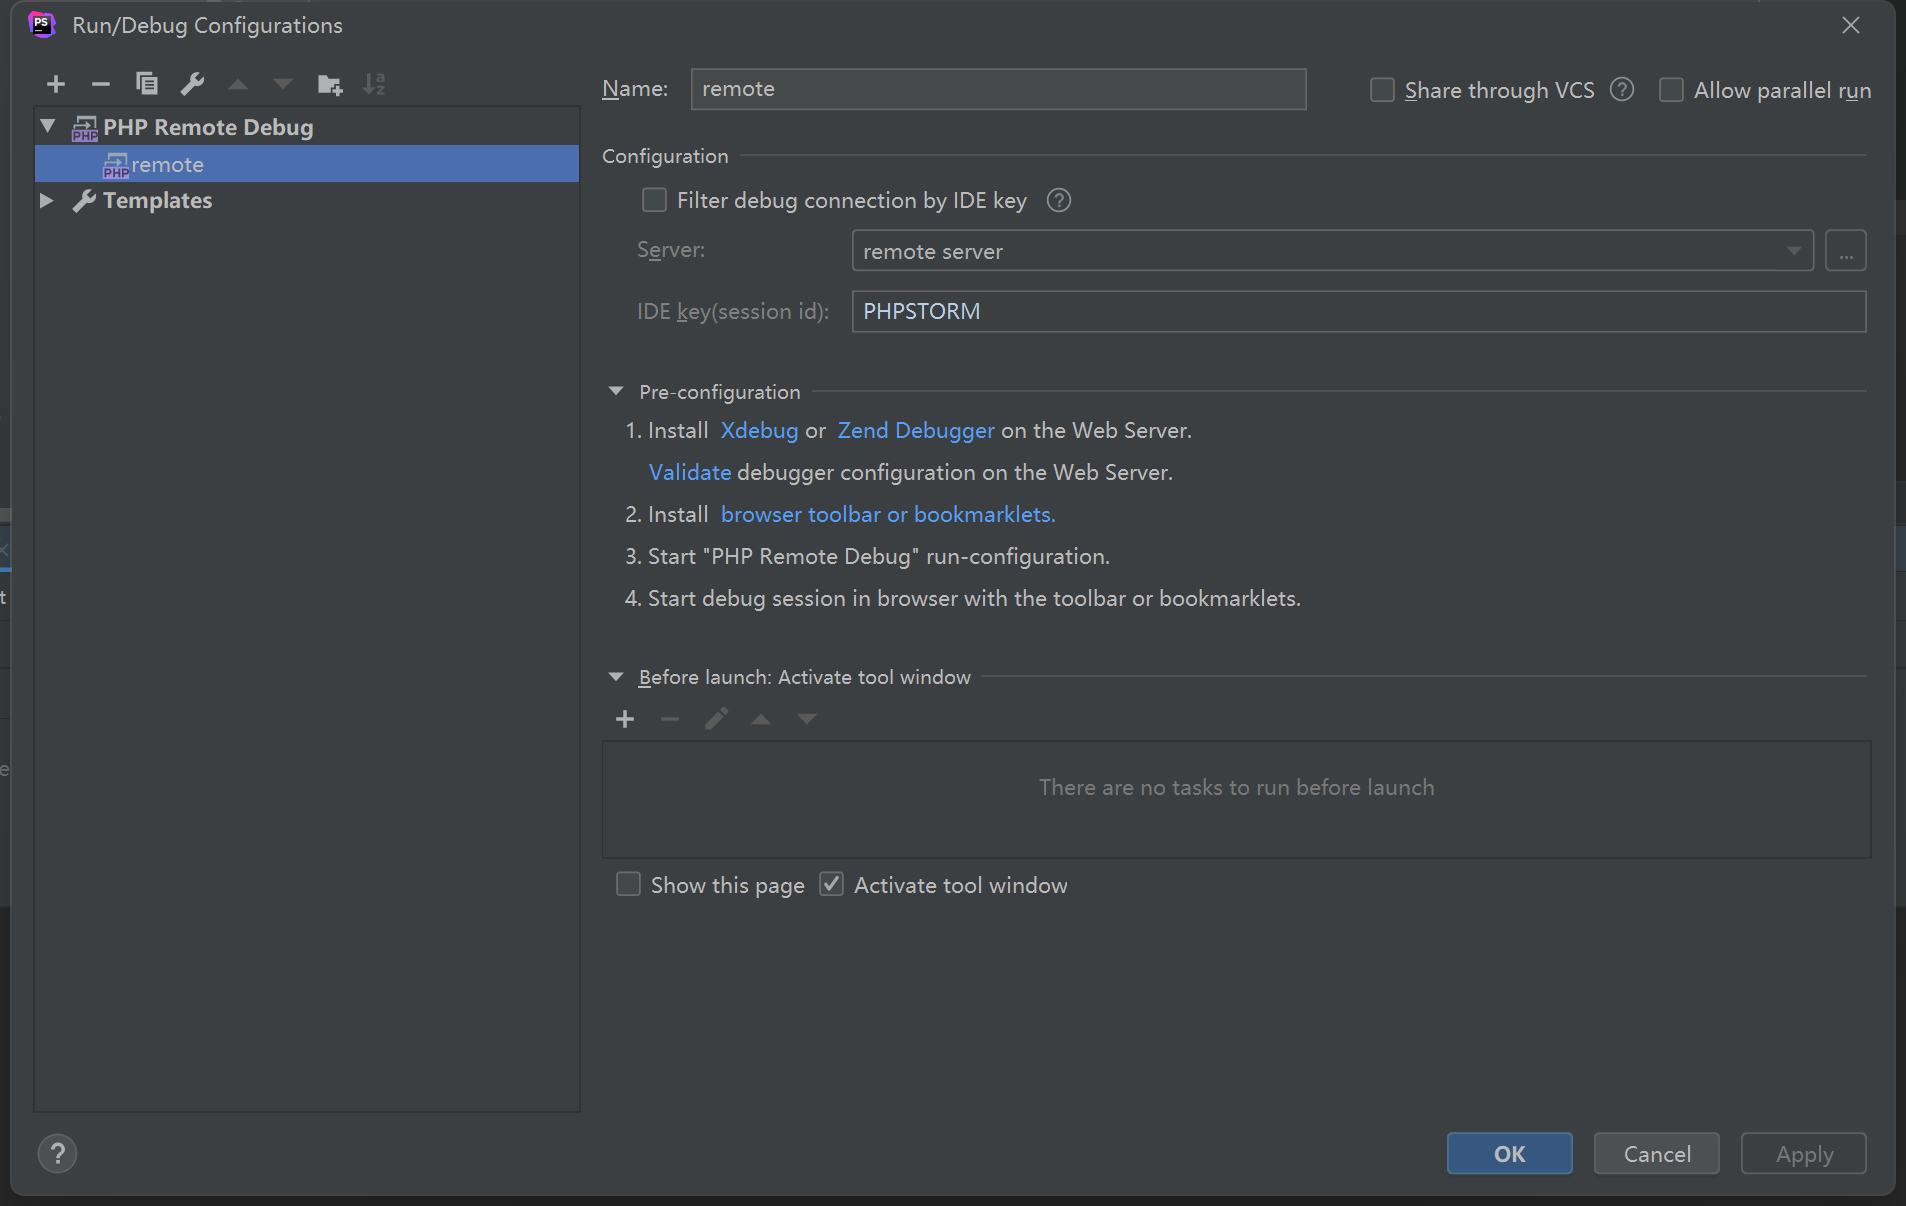
5.调试服务有了,我们可以跟当前项目添加调试配置了,如下:
6.查看xdebug日志:
可以指定配置文件:xdebug.log = /tmp/xdebug.log
然后:tail -f /tmp/xdebug.log
既可以看到链接日志。
- 调试url
http://localhost/test.php?XDEBUG_SESSION_START=1
坑
代理请求超时
- 在 nginx.conf 中添加 fastcgi_read_timeout 3600s;
- 注意 需要添加到http段,直接添加到最外层会报错, 添加到location段不报错但是不生效.
